

The Guide to Documentation Metrics
Read the articleWelcome to the future of content analytics. Our powerful analytics suite gives you the visibility you need to make data-driven decisions to optimize your content and showcase the ROI of your product knowledge.
Get a demo

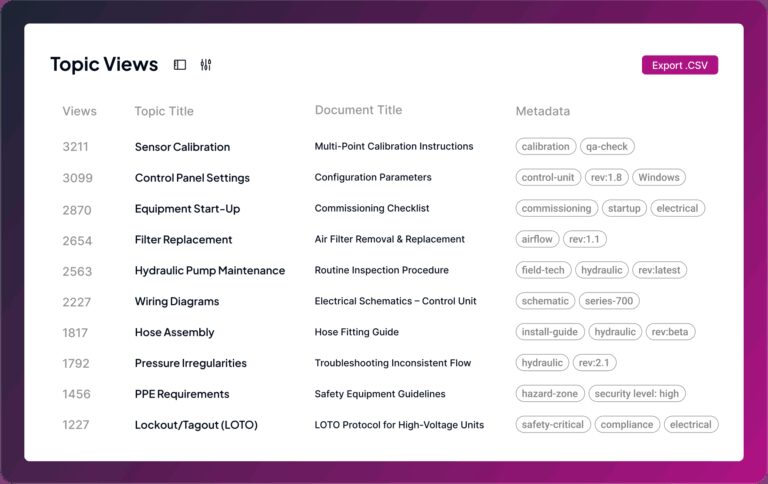
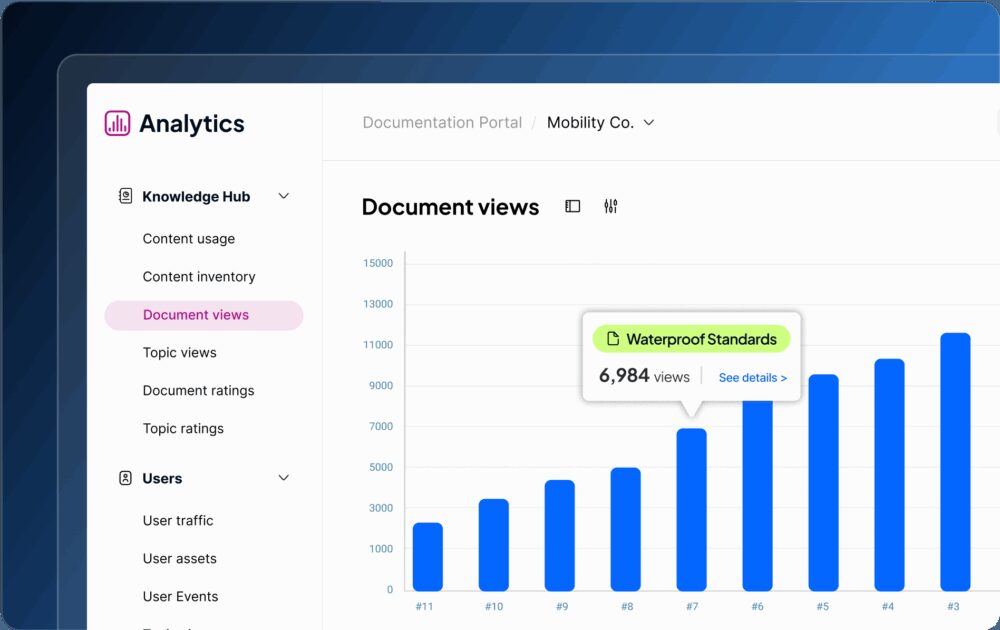
Analyze your most visited and top-performing content to understand what resonates with your audience. Focus on updating, expanding, or featuring this content to maximize its impact and value for both users and the organization.
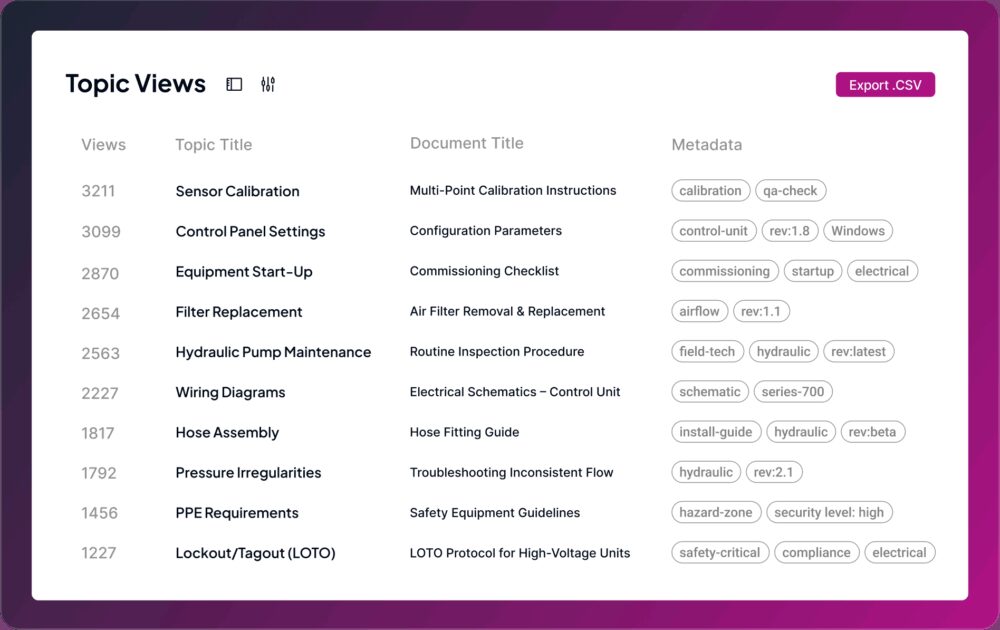
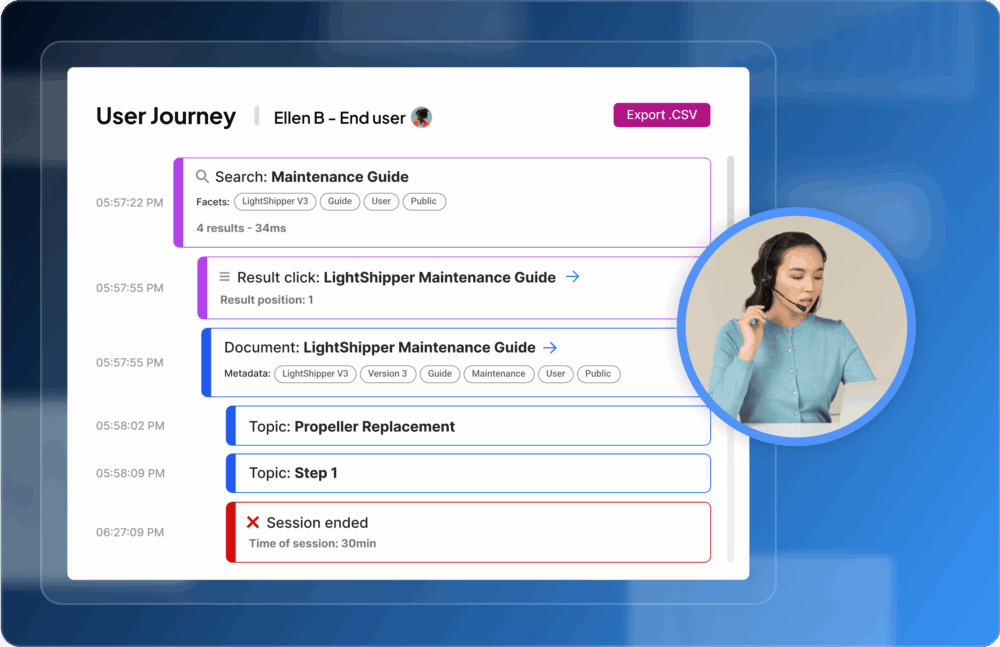
Fluid Topics captures every user interaction with high levels of detail and deep context. You’ll see every keyword search and selected facet. You’ll even see what content was viewed, down to how long a topic is displayed on a screen. Finally, you’ll know when content is accessed, what led a user to it, and much more. Capture it all and build a strong foundation for data-driven decision making.
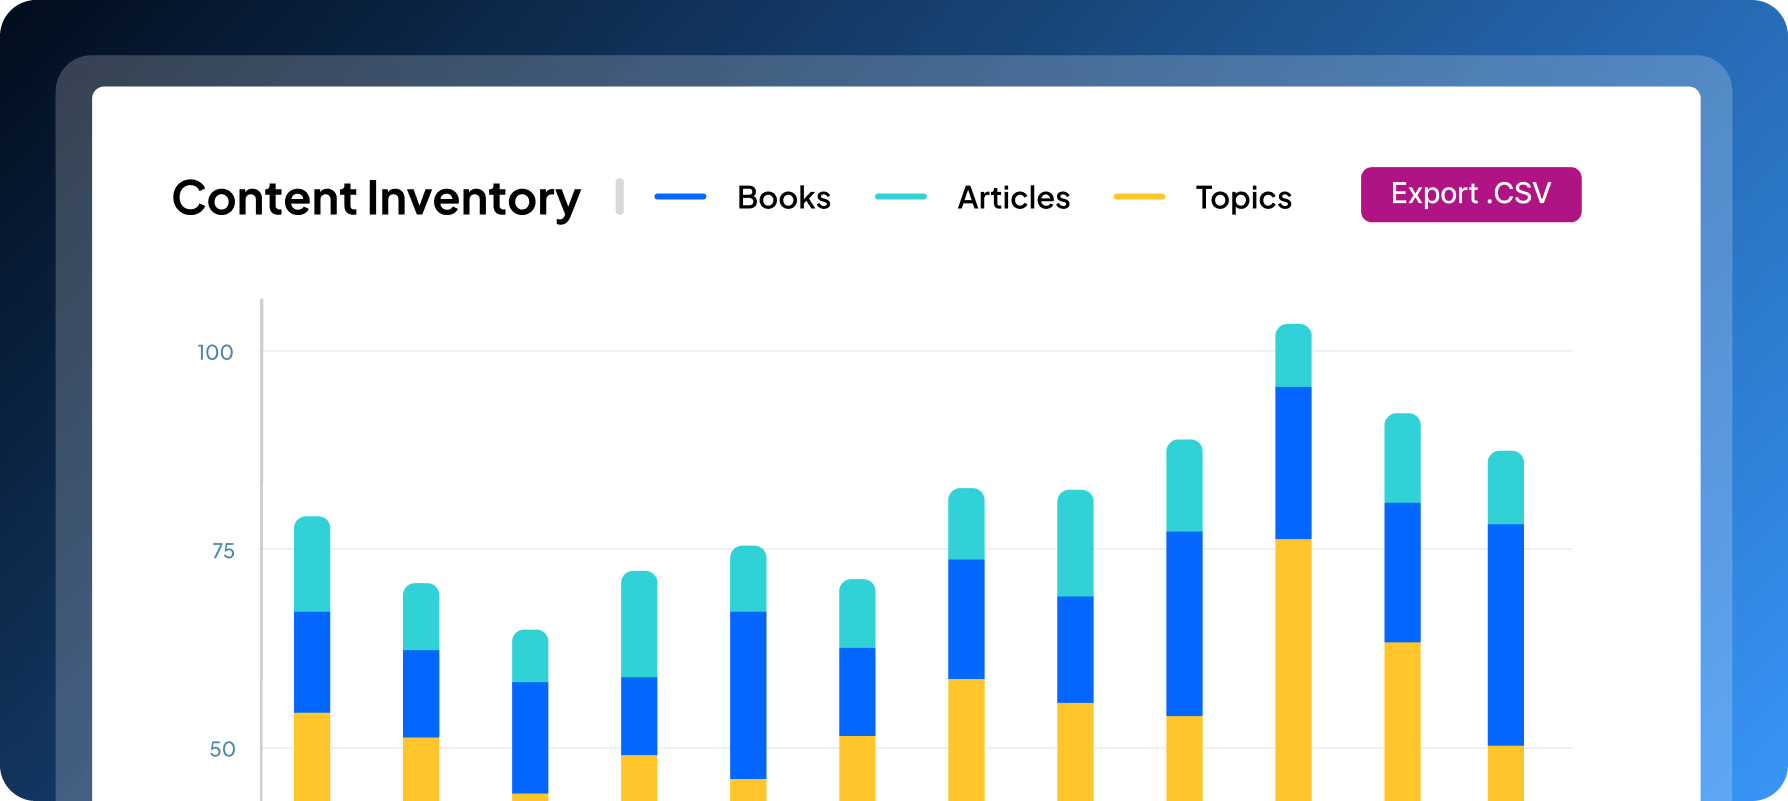
Forget page views and document downloads that offer little insight into your content’s true performance. Our advanced analytics engine goes further, analyzing content structure, metadata, user assets and more to uncover deep insights. Get powerful dashboards and metrics that highlight how your content truly perform.
Our analytics tool monitors user behavior, providing in-depth insights into their content journey. By understanding their preferences, history, and interests, you can improve customer service while ensuring complete privacy and security.
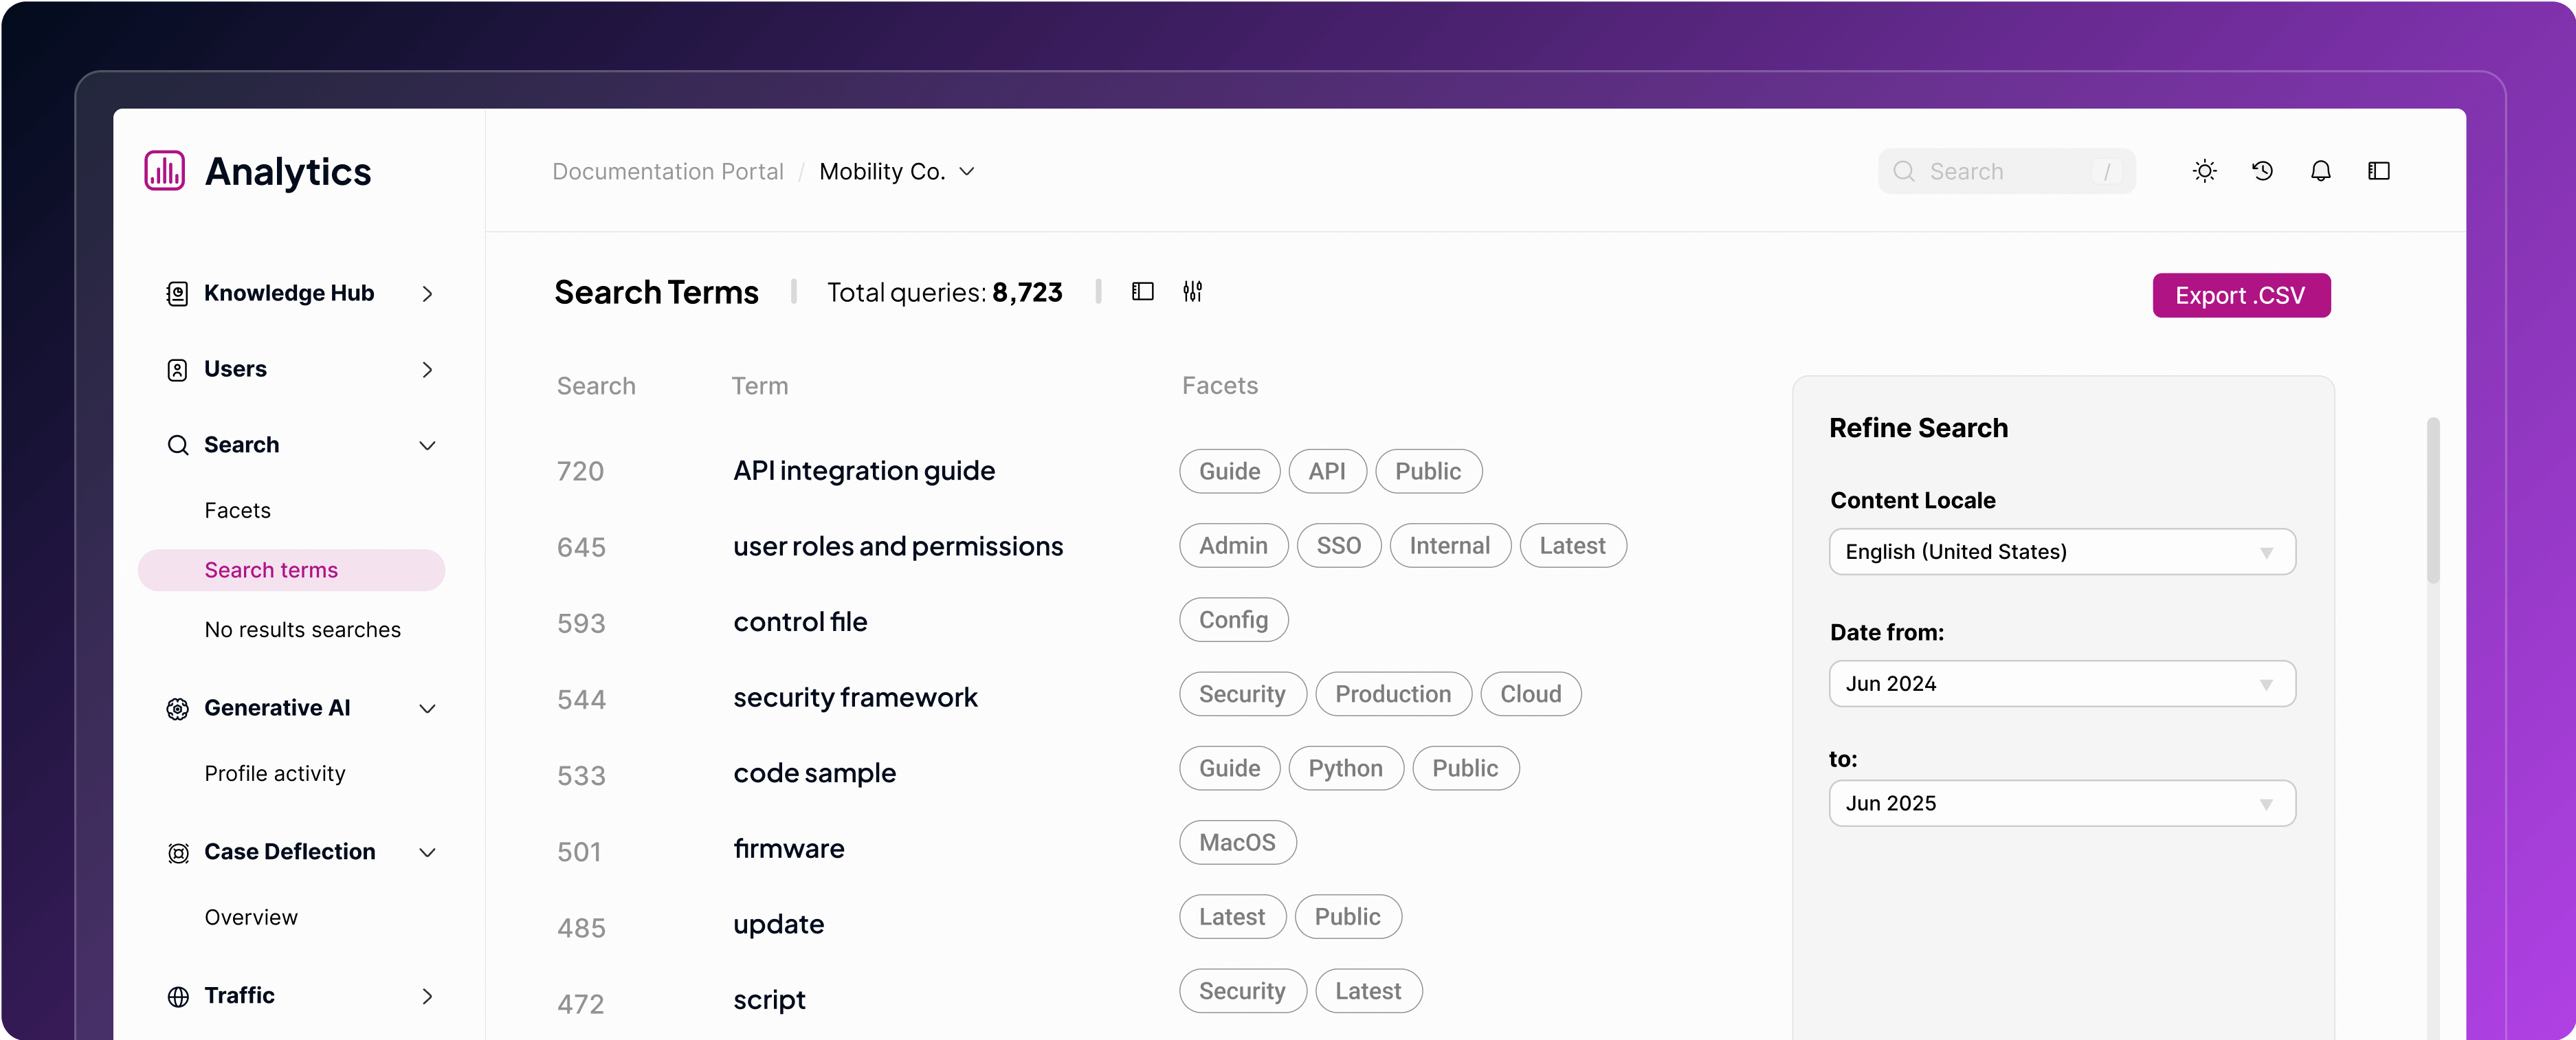
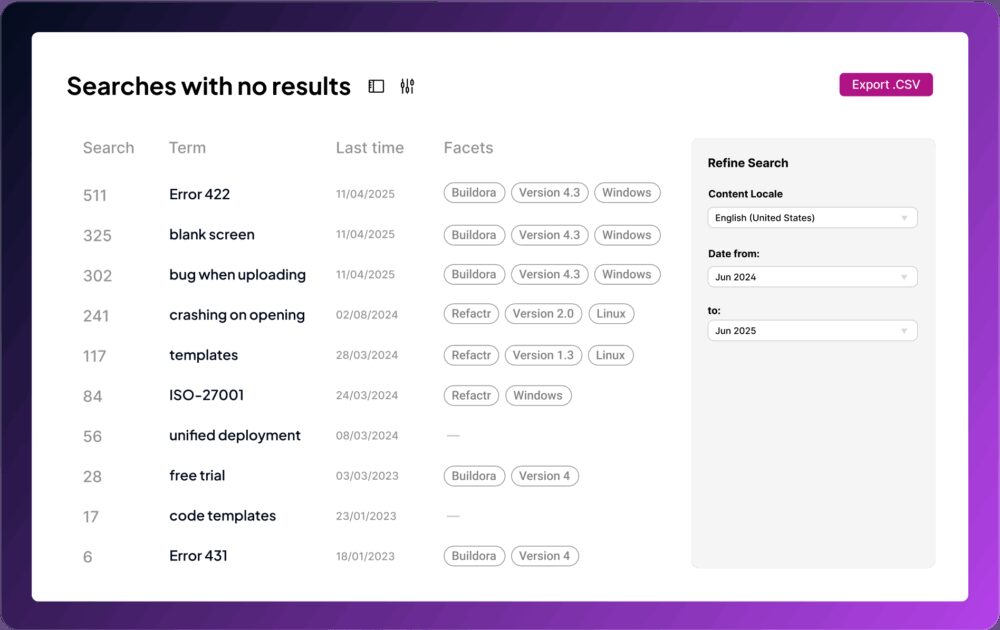
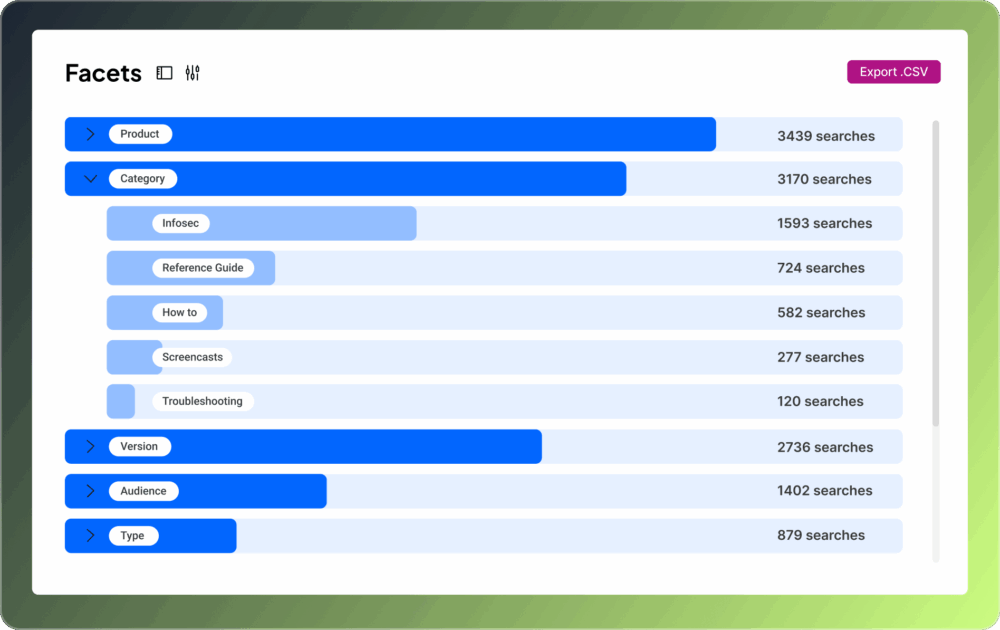
Understand what users search for and when they find nothing. Spot knowledge gaps, refine tagging, and boost discoverability.
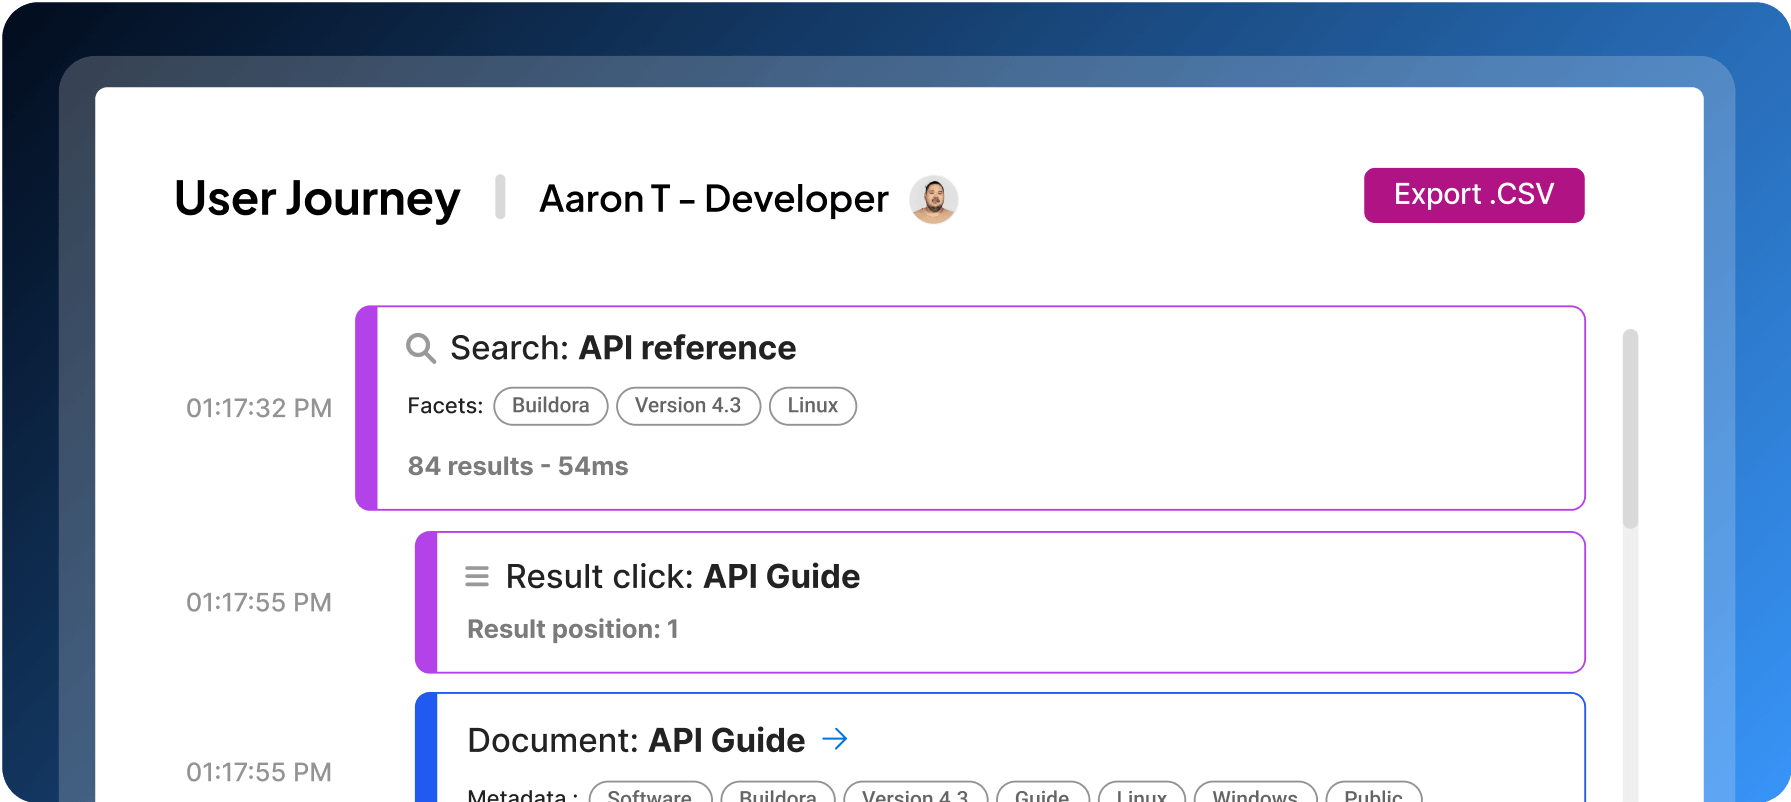
Track how users navigate your content. Identify content bottlenecks, optimize popular topics, and streamline the path to answers.
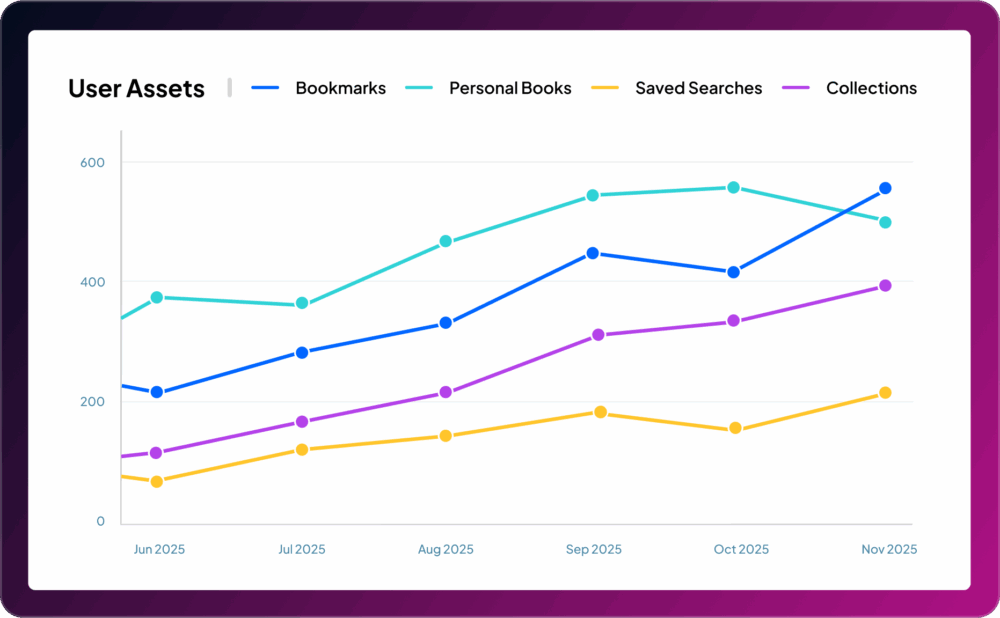
Monitor bookmarks, shared links, and personalized books. Learn which content users save and share and why it matters.
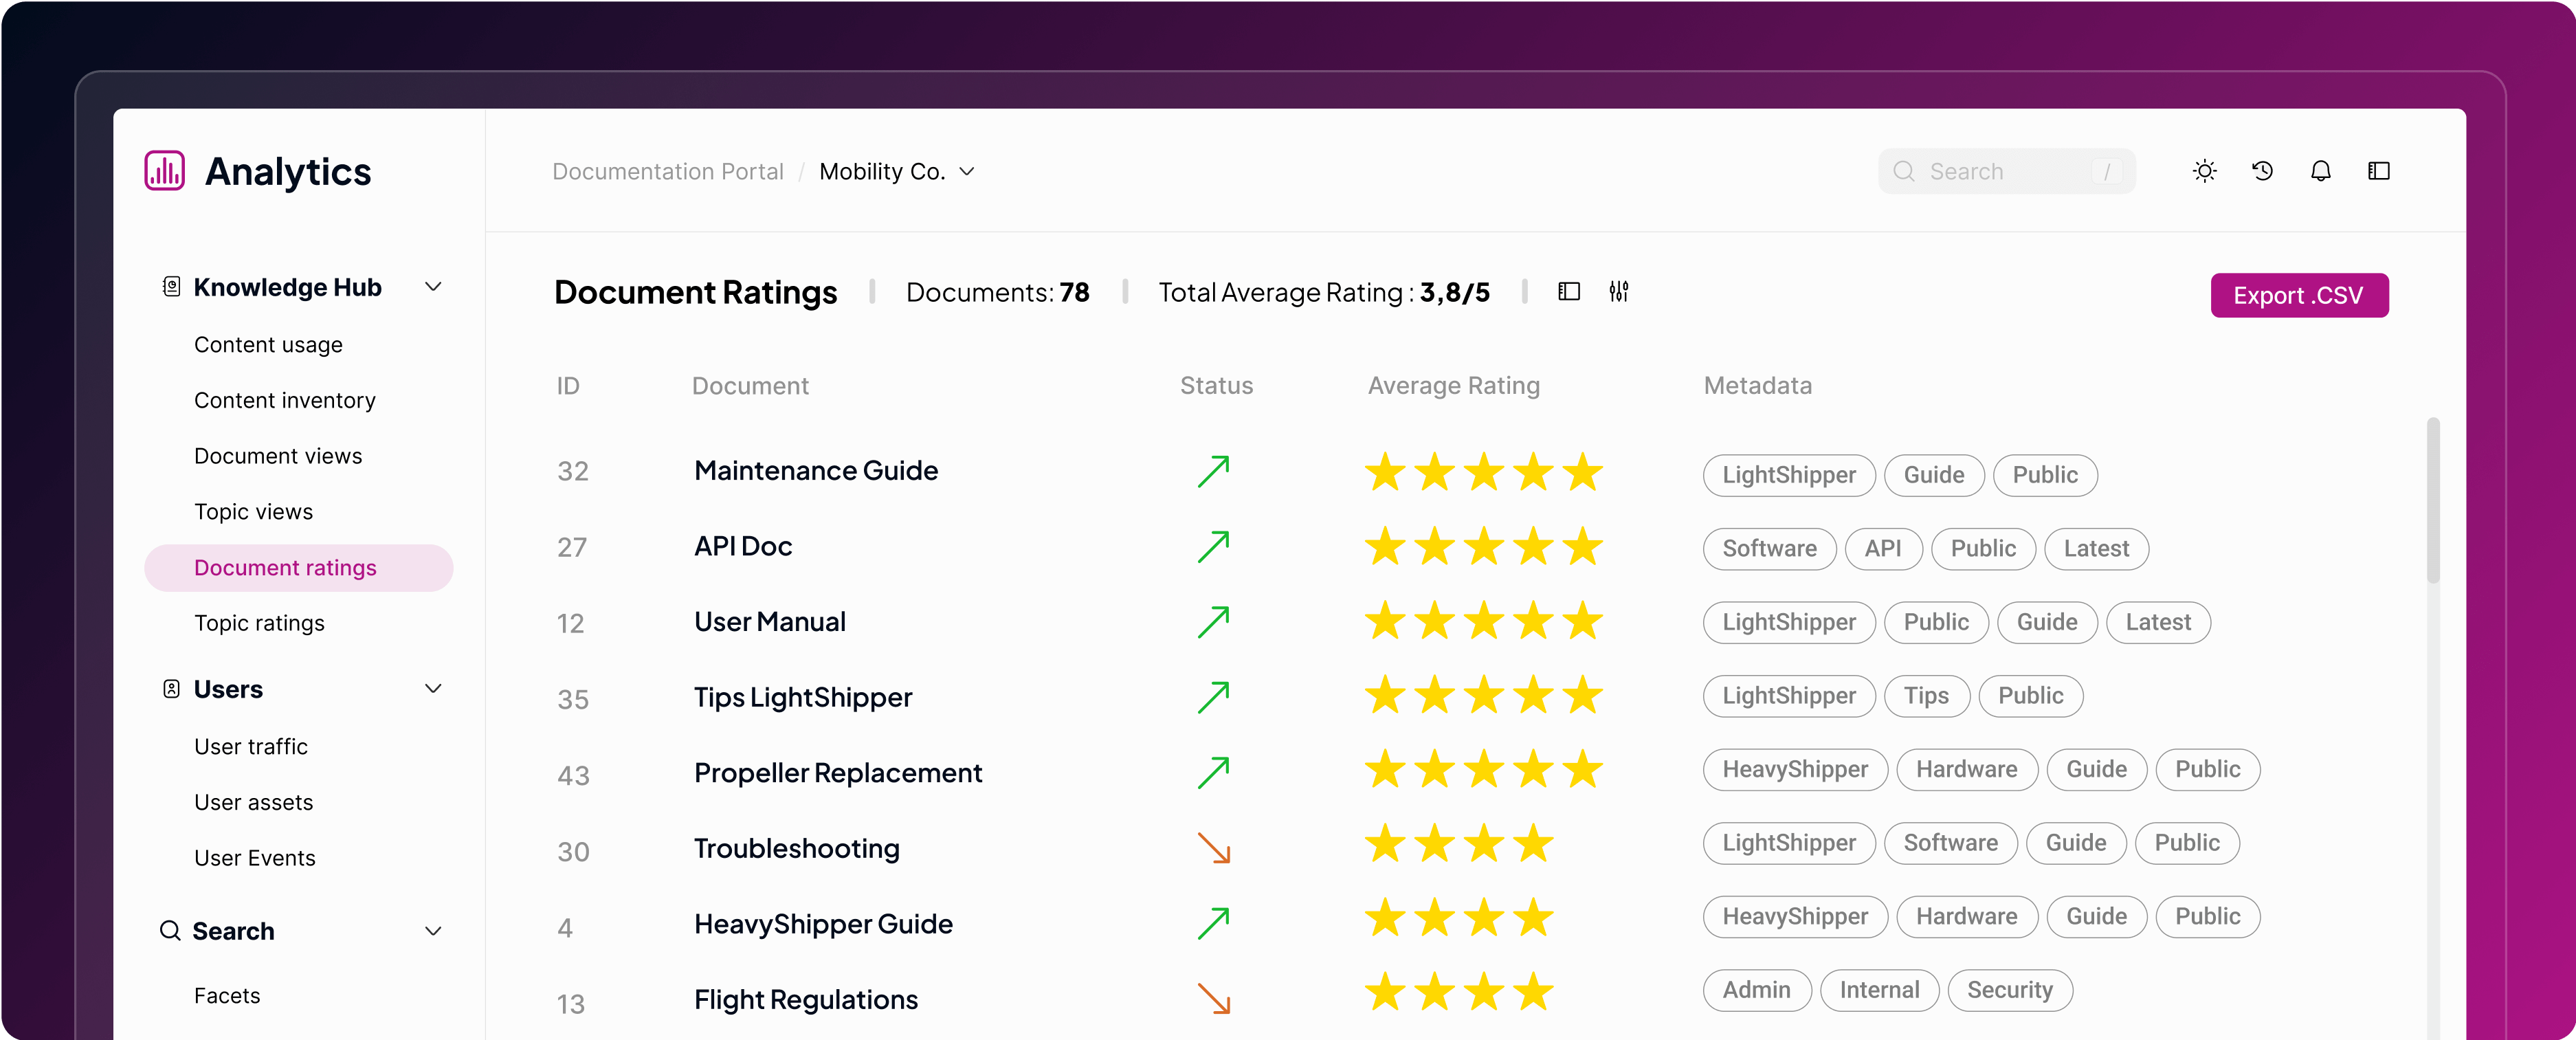
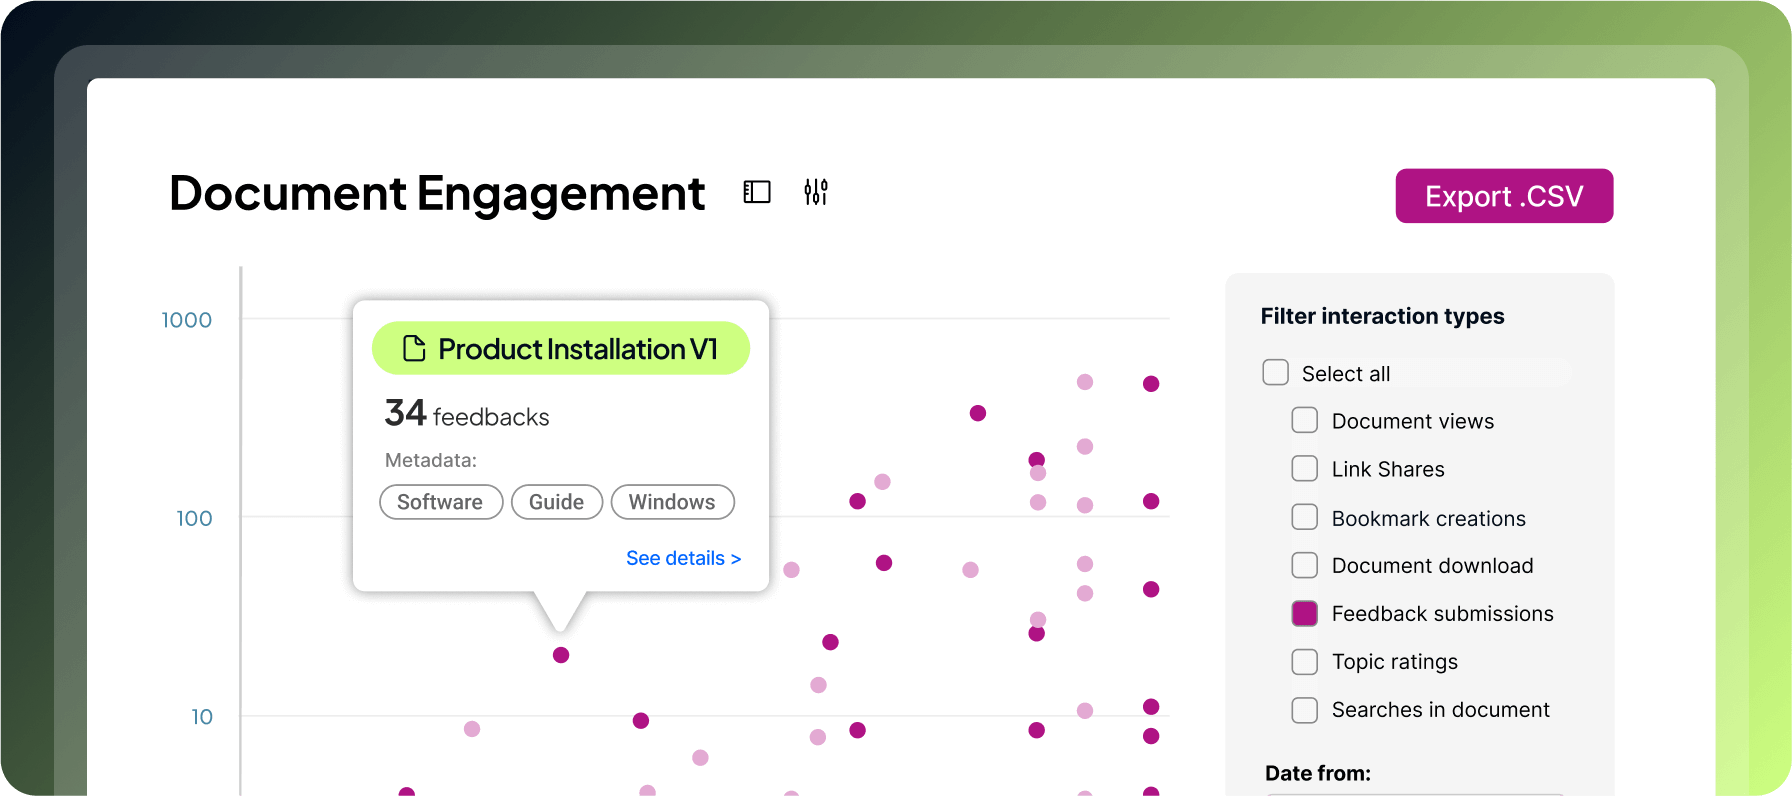
Gather direct user input through topic ratings and open comments. Spot areas to improve or promote based on real feedback.
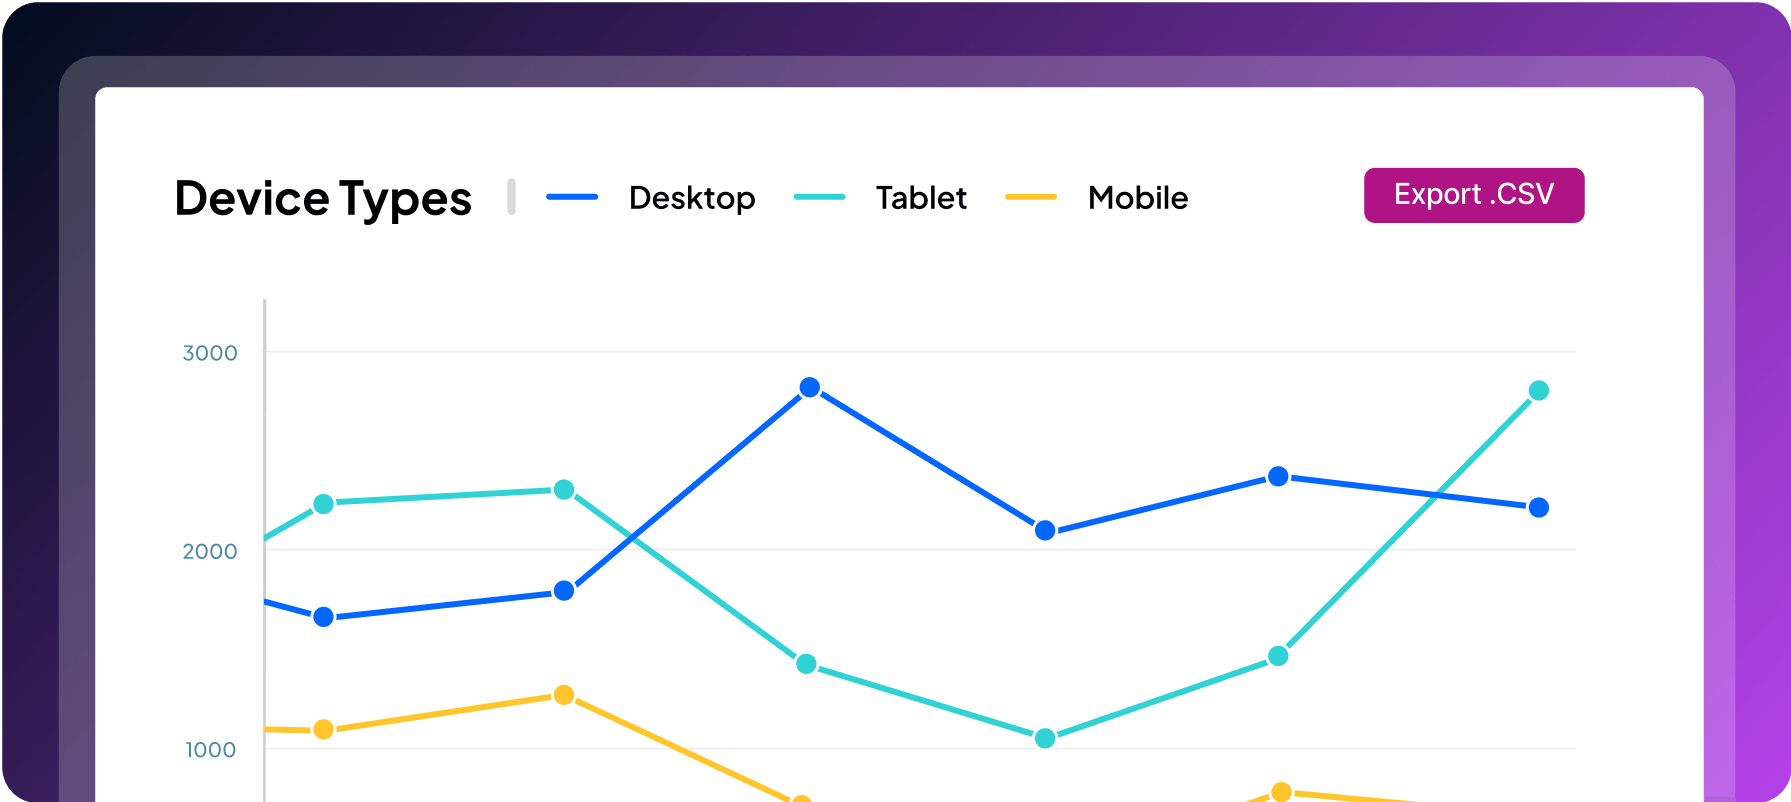
Know how users access content – mobile, tablet, or desktop. Design responsive experiences that meet your audience where they are.
Keep tabs on the frequency and speed of content updates to maintain a responsive documentation environment that evolves alongside your product.
Access insights on how users navigate between different page types within your documentation portal.
Evaluate the percentage of customer issues resolved via self-service channels rather than live agent support, and assess the resulting savings.
Track how users interact with AI-driven features like chatbots, or summarizers. Discover what users really need.
“Fluid Topics Analytics provide great insights that we can use to directly improve the quality of our doc – insights that web analytics alone can’t provide. […] When we see that people spend a lot of time on a particular topic, it raises a flag: it might mean that the documentation needs attention because it’s hard to use, or that the product itself needs attention.”

Lonnye Yancey-Smith
Executive Manager at Hexagon Asset Lifecycle Intelligence
We create cutting-edge technical content experiences that provide our customers with the competitive edge they need to succeed.
Content metrics are measurable indicators used to evaluate the quality, effectiveness, usability, and impact of documentation, such as user manuals, API docs, help centers, or internal knowledge bases.
These metrics help technical writers, content strategists, and product teams ensure documentation is meeting user needs and supporting business or product goals.