“How do you know that your content is performing?” We get this question a lot when discussing with prospective customers! As we become increasingly data-driven, we are inundated with countless sources of data. Most of the time, organizations don’t quite know what to do with this data. In today’s digital world, even the savviest technical content experts can find using analytics to be a challenge.
Yet, without a close look into the performance of your product content, you have no evidence that the content your technical writers have invested so much time producing is actually working. Ultimately, not evaluating content effectiveness brings real costs and risks to these organizations.
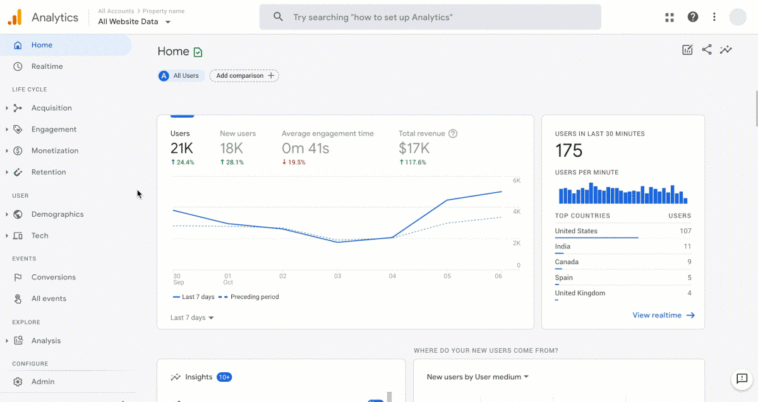
These days, most companies use web-based analytics such as Google Analytics to track sessions, users, pages, flow, duration, bounces, and campaigns. These metrics give some insights into a company’s content and are great for marketing websites. However, they are not designed for technical documentation and cannot properly guide your content decisions.

Based on our experience at Fluid Topics, we’ve identified four content metrics that are essential to transforming your technical documentation into a true business asset.
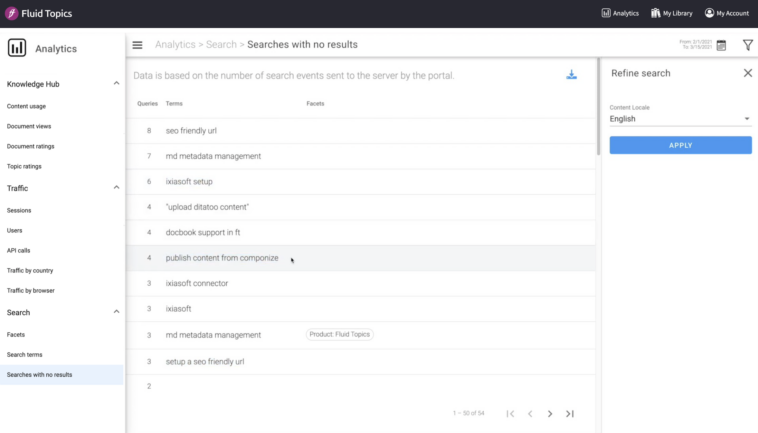
Search with « no results »
If your content cannot be found, it might as well not exist. There is nothing more frustrating for a user, or even worse, for your support team than not finding the answers they were looking for. Fluid Topics’ Content Delivery Platform (CDP) provides an intelligent content analytics feature that gives admin users precise content consumption metrics, including « searches with no results ». This data is a gold mine for technical writing teams. It shows all the searches left unanswered.

Our clients’ technical documentation teams use this data to select the best course of action for their content:
- They check whether the content is wrongly tagged
- They add more synonyms
- They create new taxonomies
- They improve their existing copy
- They write new documents to fill the content gap
To provide user with the most relevant and up-to-date content experience, companies need to have this data at hand.
Most and least read topics
With traditional analytics, you know that a PDF has been downloaded or an HTML page clicked through, but you don’t know if your document has been read, much less what section or topic. In this respect, for technical documentation teams, identifying the most-read topics is key to detecting patterns in their users’ searches. This data highlights your most interesting and valuable content. It also determines precisely whether your product or content has a problem or needs an update.
“When we see that people spend a lot of time on a particular topic, it raises a flag: it might mean that the documentation needs attention because it’s hard to use, or that the product itself needs attention,” said Lonnye Yancey-Smith, Executive Manager at Hexagon Asset Lifecycle Intelligence and one of our clients.
Additionally, by cross-checking these metrics with the support tickets and eventually the ratings, you get a complete view of the content issues.
Similarly, analyzing the least-read topics gives your team unique insights into how users are interacting with your content. There are several reasons as to why your content is not read:
- It might be wrongly tagged and cannot be found
- The topic is of less interest for users and shouldn’t be prioritized for any new content work or updates
- The product is working as expected and users just don’t need to view the documentation
A CDP such as Fluid Topics captures every user interaction with high levels of detail and deep context. All the ways people interact with your content over time can be reported and used to make informed decisions. It allows companies to spot areas of product friction, as well as potential churn risks.
“These new content analytics have helped to challenge long-standing beliefs about how content was used. Now, the team can easily understand what users have searched for and for how long or if for example there are topics that have never been visited. We use these insights to drive our documentation effort”, explained one of our software clients.
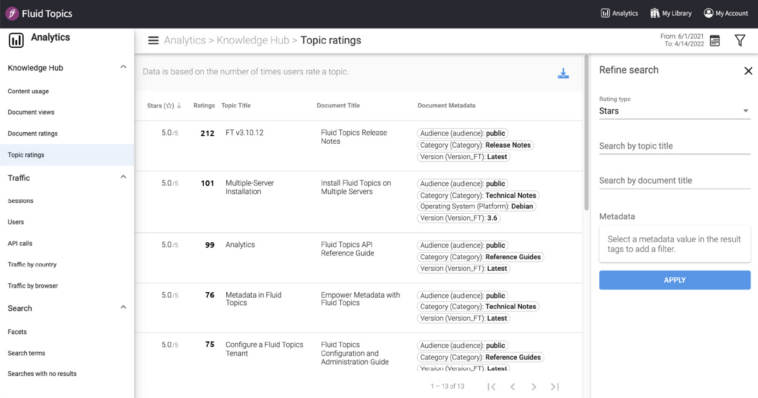
Document and topic ratings
Traditionally, technical communication has been unidirectional and has happened behind the scenes. A variety of writers have produced voluminous amounts of content over time without engaging users in any way, much like Web 1.0. But the Web has evolved from a network of static textual content to a social platform, and Content Delivery Platforms have emerged and taken this trend into account. So, what if you could enhance the user experience via your next-generation content analytics?
Document and topic ratings (and feedbacks) are great insights to get a clear picture of what’s important for your users. For example, low ratings give you more information on the quality of your content and allow you to locate outdated, inaccurate or even unhelpful content. By understanding your ratings, you can also gauge the work that might need to be done to improve your documentation and therefore prioritize it.

Encouraging users to participate in conversations is key to improving satisfaction with your documentation.
Time spent reading a section
Do you ever wonder how much time people spend reading your content? Time spent is an essential metric in engagement study.
The time spent metric can identify some possible useability issues with your documentation. If users only spend two minutes on a page, but the content should take about eight minutes to read, this information can help signal that your content might be irrelevant, or difficult to understand and that it’s time to revise your documentation. It might also mean that the keywords you’re using are not meeting your customers’ expectations.

Technical documentation has the ability to play a more strategic role in any organization and correctly analyzing the time spent metric can provide great value for all customer-facing areas.
Leverage the right metrics
Since its inception, Fluid Topics has been tackling the challenge of leveraging data and documents that are spread through silos in the enterprise.
When technical content is no longer tied to printed pages or other static formats, it sheds light on how users interact with it. Technical documentation teams can now harness the power of content analytics provided by a CDP and the principles of user experience to evaluate specific user behaviors and ensure continuous improvement of their technical and product content.
Once organizations start measuring the right metrics, they can make impactful changes for their users and their corporate KPIs.
If you’re eager to learn more about Content Analytics, here is a great demonstration by Géraldine Boulez and Leanna Inzalaco of how a Content Delivery Platform can help your users improve their content efficiency with the right metrics.


